Taking WNBA Stats to the Next Level

The analytic revolution in the WNBA has lagged a few years behind that of their NBA counterparts, in large part because of a dearth of accessible data. Now, the league’s stats team has reworked the WNBA stats database to more closely resemble the NBA’s, opening up a surplus of new tools to work with.
Finally, we have lineup stats, clutch stats, advanced box scores, detailed shooting breakdowns and shot charts, and all the filters you would ever need to slice the data any direction your curiosity leads you. You can check out the WNBA’s new, revamped stats page here and below we’re walking you through a few interesting statistical nuggets from the league’s opening weekend to highlight some of the new data offerings.
Clutch Buckets and the Indiana Fever
There was no bigger basket in the WNBA’s opening weekend than rookie Teaira McCowan’s buzzer-beating layup to help the Indiana Fever beat the New York Liberty. Thanks to new clutch stats being available we can now put some of those huge plays into a better context.
While McCowan’s play finished off the win, it was her teammate, Erica Wheeler who drove the Fever in crunchtime. In the five minutes of clutch play during this game, Wheeler was 2-of-3 from the field with an assist and a 3-pointer. That strong performance is even more impressive when you consider that Wheeler, often a complementary offensive player, scored just seven points in 23 clutch minutes all of last season.
Scoring Styles and the Minnesota Lynx
The Minnesota Lynx will be without Maya Moore this season, a fixture of their offense for the past few seasons. Without Moore’s perimeter attack, the Lynx will likely have to lean more on their interior advantages and at least in their first game of the season, the formula worked to perfection. The Lynx rolled to an 18-point victory over the Chicago Sky in their season opener, powered by a combined 43 points and 16 rebounds from their veteran center, Sylvia Fowles, and rookie forward, Napheesa Collier.
The Lynx were +8 on the Sky in points in the paint, the second-biggest margin of any team in their first game, and, with 17 offensive rebounds, outscored Chicago by 16 in second-chance points. More than half of Minnesota’s shots came in the paint and their heat map has a glowing red dot right in the center (which doesn’t even account for their 32 free-throw attempts).

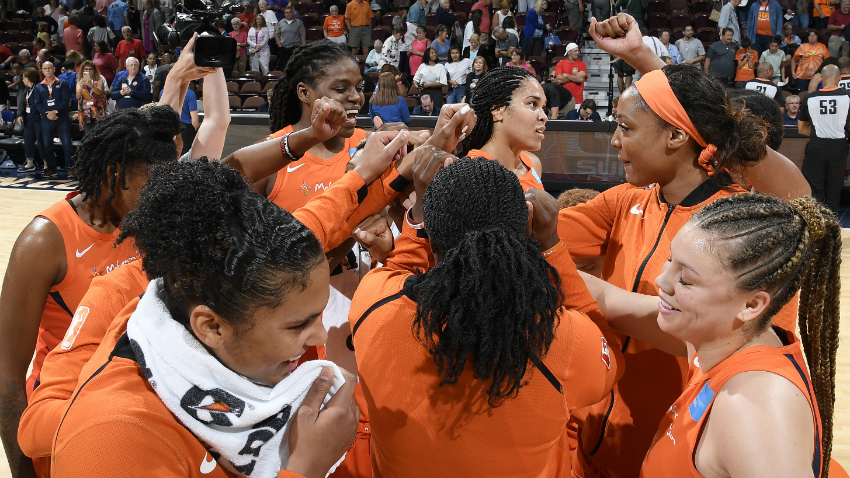
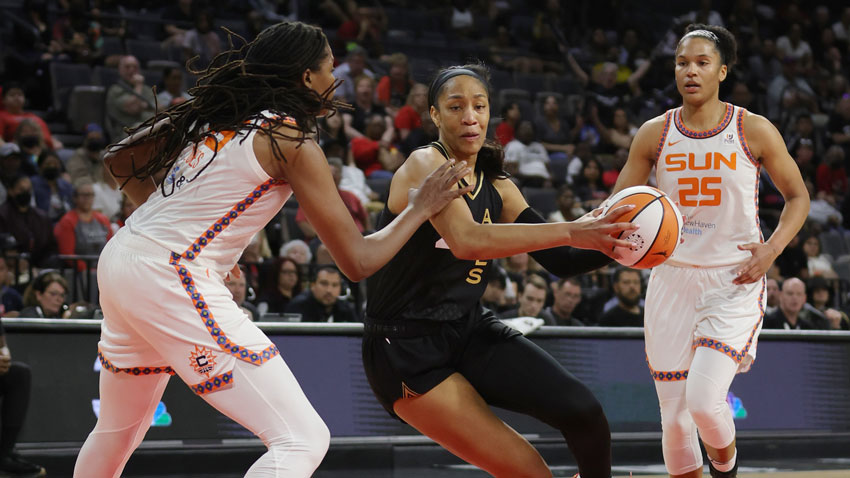
Lineups and the Connecticut Sun
One of the most useful of the new WNBA statistical offerings is the ability to check out a variety of statistics for multi-player units. Sample sizes are still pretty small but it’s easy to pick out groups that have been effective in the early going, like the new starting lineup of the Connecticut Sun — Jasmine Thomas, Shekinna Stricklen, Alyssa Thomas, Jonquel Jones and Courtney Williams. That lineup played 18 minutes in the Sun’s season-opening win over the Mystics, outscoring Washington by an average of 38.9 points per 100 possessions.
This group played together a fair bit last year — it was the second-most used lineup by the Sun during regular season, posting an enormous plus-13.7 point differential per 100 possessions. In fact, this group had the fifth-best point differential of the 24 five-player units that played at least 75 minutes last year. With Jonquel Jones replacing Chiney Ogwumike in the starting lineup, the Sun aren’t sacrificing any skill and are able to roll out a group with three different players who made at least 37 percent of their 3s last season. The Sun are looking to make a deep playoff run and this lineup will be key to driving their chances.
These are just a few examples of how this new statistical data can enhance today’s analysis of the WNBA from a league, team or player perspective. Having the numbers to couple with the eye test only provides added depth and insight to the debates that fans and analysts have about the game.
Nylon Calculus covers basketball analytics for The Step Back, the premium NBA vertical at FanSided.com
,xPosition=.5,yPosition=.5)
,xPosition=.5,yPosition=.5)
,xPosition=.5,yPosition=.5)
,xPosition=.5,yPosition=.5)