
News
,xPosition=.5,yPosition=.5)
Game 12: Seattle @ Los Angeles, 98-67
Jun 18, 2025,xPosition=.5,yPosition=.5)
Mackenzie Holmes returns to the Storm
Holmes was selected by the Storm at No. 26 in the third round of the 2024 WNBA Draft and played in the team’s only preseason game against Connecticut on Sunday, May 4, 2025.
Jun 16, 2025,xPosition=.5,yPosition=.5)
Game 11: Seattle at Golden State, 76-70
Jun 15, 2025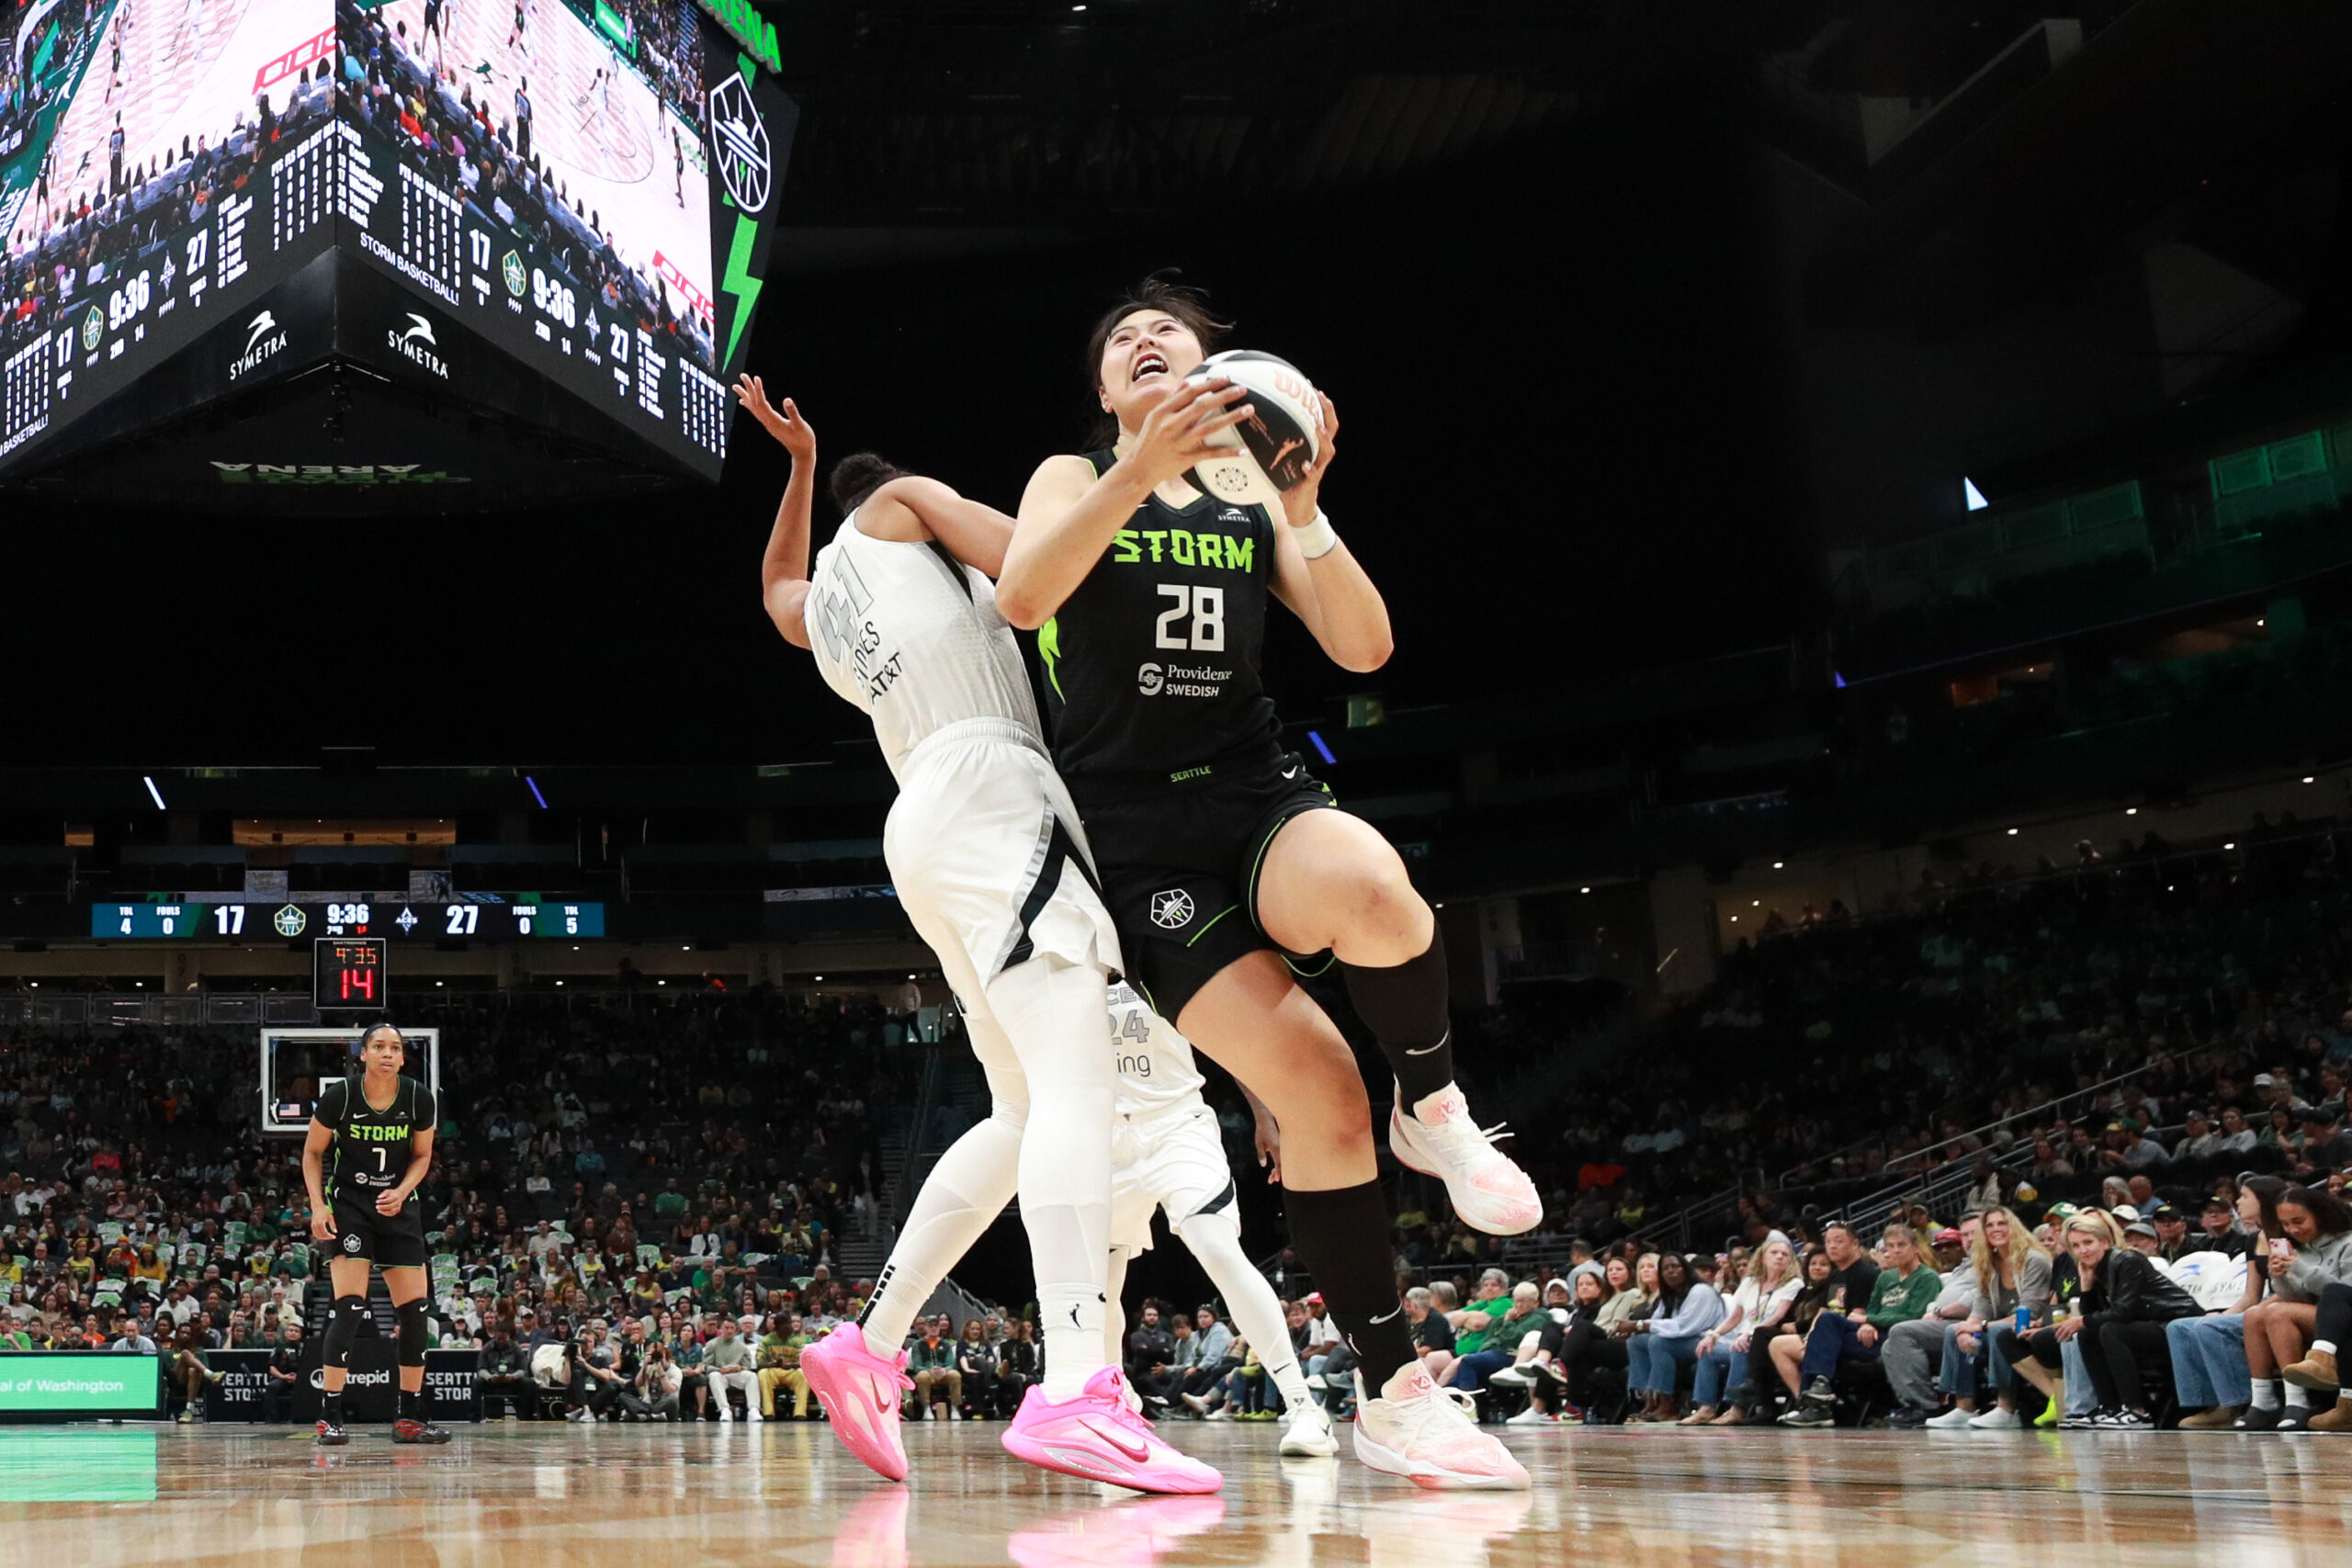,xPosition=.5,yPosition=.5)
,xPosition=.5,yPosition=.5)
Game 10: Seattle vs Minnesota, 94-84
Jun 12, 2025,xPosition=.5,yPosition=.5)
Game 9: Seattle @ Phoenix, 89-77
Jun 8, 2025,xPosition=.5,yPosition=.5)
Game 8: Storm vs Dallas, 83-77
Jun 5, 2025,xPosition=.5,yPosition=.5)
Game 7: Storm vs Aces, 75-70
Jun 2, 2025,xPosition=.5,yPosition=.5)